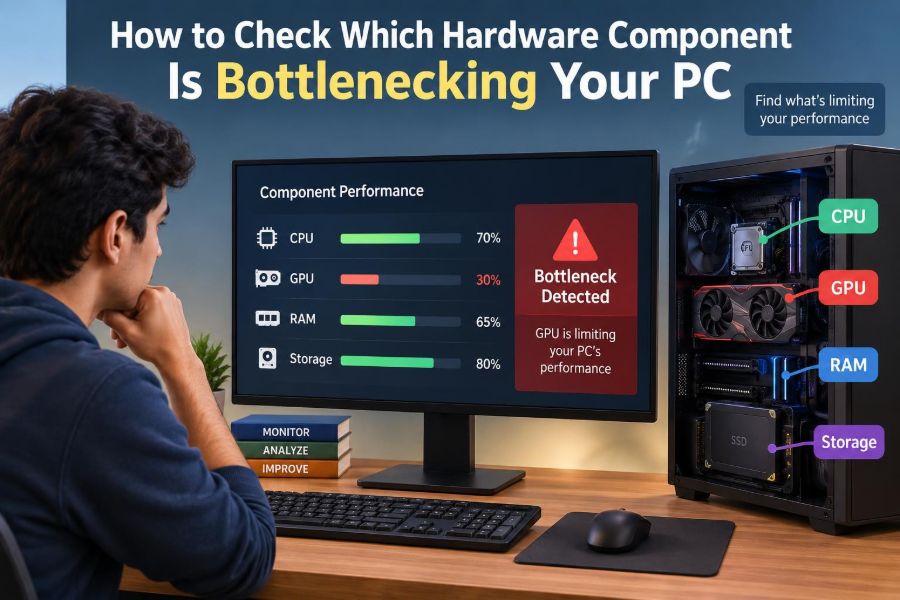

Your PC may feel slow in only one situation: a game stutters when explosions fill the screen, a video export crawls near the finish line, or a browser becomes unresponsive with dozens of tabs open. That pattern is a useful clue. A computer is not simply “fast” or “slow.” Different tasks stress different parts of it.
It is tempting to blame the oldest-looking component, or to assume that more RAM will fix every problem. That can lead to expensive upgrades that barely change the experience you care about.
A bottleneck is the component, setting, or condition that currently limits the rate at which a task can be completed. Finding it means observing your PC while the problem is actually happening, then interpreting the evidence in context.
The goal is not to make every usage graph reach zero. It is to identify the constraint that matters for your workload, rule out software and temperature problems, and make the most sensible next change.
🚦 What a PC Bottleneck Actually Means
Think of a computer as a production line. The CPU prepares instructions, the GPU draws images, memory holds active data, storage supplies files, and the network moves information between machines. The overall job cannot proceed faster than its most constrained stage.
A bottleneck is therefore workload-specific and time-specific. A graphics card may limit a demanding game at high resolution, while the same PC may be limited by its CPU during a large spreadsheet calculation. Opening a game launcher may instead wait on storage or the internet.
🔄 Why the Bottleneck Can Change During One Task
Even a single application can shift its limiting component. A video editor may use storage while importing clips, CPU while decoding a format, GPU while applying supported effects, and storage again while exporting the finished file.
Do not diagnose a PC from an idle desktop or one brief spike. Monitor a repeatable part of the job: the same game scene, the same export, or the same project build. A changing bottleneck is normal; a persistent one is usually where improvement is possible.
🧭 Start With the Symptom, Not the Upgrade
Describe the problem precisely before opening a monitoring tool. “My PC is slow” is too broad to test. “Frames drop when I enter busy cities,” “Windows pauses when I open large photos,” or “compiles take several minutes” gives you a measurable target.
- Low average frame rate: often GPU, CPU, or game settings.
- Brief freezes and hitching: may involve RAM pressure, storage access, shader compilation, background tasks, or heat.
- Long loading times: often storage, network, server response, or decompression work.
- Slow multitasking: commonly RAM capacity, CPU background load, or a crowded startup list.
A clear symptom prevents an unrelated component from being blamed.
🛠️ Use Built-In Monitoring Tools First
On Windows, Task Manager offers a practical first view. Press Ctrl + Shift + Esc, then use the Processes, Performance, and Details tabs. Resource Monitor, launched from Task Manager or the Start menu, provides a closer look at disk activity, memory faults, and individual processes.
For gaming, an overlay that displays frame rate, frame time, CPU use, GPU use, temperatures, clock speeds, and memory use is especially helpful. Hardware vendor utilities and well-known monitoring applications can provide these readings, but their labels and calculations can differ. Use one consistent tool while comparing tests.
📏 Measure During a Repeatable Workload
Start monitoring, reproduce the issue, and observe for long enough to see a pattern. A 10- to 15-minute game session or a complete render is more informative than a single second of activity.
Keep test conditions stable where possible: use the same game location, resolution, graphics preset, power mode, project file, and background applications. If every variable changes at once, you cannot tell what caused the result.
📊 Read Utilization Without Treating It as a Verdict
Utilization is the percentage of a resource currently being used, but it is not a universal scorecard. A GPU at 99% during a stable game is often simply doing its intended job. A CPU at 45% can still be the limit if one or two important cores are fully occupied.
Look for a consistent relationship between a component’s activity and the symptom. Does the GPU remain near full use while frame rate is lower than desired? Does disk activity surge exactly when an application freezes? Patterns matter more than one number.
🎮 Recognize a GPU-Limited Game
In a GPU-limited game, the graphics card is busy rendering nearly every frame. GPU utilization often stays very high, while the CPU has enough spare capacity overall. Raising resolution, ray tracing, shadows, anti-aliasing, or other visual settings usually lowers frame rate further.
A useful test is to reduce graphics settings or resolution substantially. If frame rate rises clearly, graphics workload was a major limit. If the frame rate barely changes, the GPU may not be the primary constraint in that scene.
This is not automatically a fault. A GPU being fully used is desirable when visual quality is the priority; it only becomes a practical bottleneck when performance falls below your target.
🧠 Spot a CPU-Limited Game or Application
CPU limits are common in simulation-heavy games, competitive titles aiming for very high frame rates, strategy games with many units, and tasks such as code compilation. The processor prepares game logic, physics, AI, draw calls, and other work before the GPU can render the result.
Check per-core or per-logical-processor graphs rather than relying only on total CPU usage. One busy thread can hold back the task while the average across many cores appears moderate. Reducing resolution may make little difference because it reduces GPU work, not the CPU’s preparation work.
🧩 Understand CPU Cores, Threads, and Single-Thread Limits
A CPU core can execute instruction streams, while many processors can expose additional logical threads through simultaneous multithreading. Applications vary greatly in how well they divide work across these threads.
Some workloads scale across many cores; others depend heavily on the speed of one main thread. In the latter case, faster per-core performance, better cooling, lower background load, or game settings that reduce simulation complexity can matter more than simply having more cores.
⏱️ Use Frame Time to Find Stutter
Frames per second, or FPS, is useful, but frame time often reveals why motion feels uneven. Frame time measures how long each frame takes to produce, commonly shown in milliseconds. A stable line usually feels smoother than an average FPS number with frequent tall spikes.
A spike can come from CPU work, a storage read, insufficient memory, shader compilation, an overlay, or background activity. Compare the spike with resource readings and repeat the same scene. One isolated spike is less meaningful than a recurring pattern.
🧮 Distinguish System RAM From Graphics Memory
System RAM holds data needed by Windows and applications. GPU memory, often called VRAM, holds textures, frame buffers, geometry, and other graphics data close to the graphics processor. They are related but not interchangeable.
When RAM capacity is strained, Windows may move less-active data to the page file on storage. When VRAM is strained, a game may reduce texture quality, stream data more aggressively, or show stutter. Integrated graphics use part of system memory, so their behavior differs from a discrete graphics card.
📚 Identify RAM Capacity Pressure
High memory use alone is not conclusive because operating systems deliberately use spare memory for caching. More telling signs include a system becoming less responsive while several applications are open, frequent disk activity during ordinary switching, or a noticeable rise in memory compression and paging.
In Task Manager, check memory use, committed memory, and available memory. Resource Monitor can show hard faults per second, meaning data had to be retrieved from storage rather than current physical memory. Brief faults are normal; persistent activity during a slowdown suggests pressure.
💾 Separate Storage Speed From Storage Saturation
Storage bottlenecks are not just about whether a drive is an SSD or hard disk. A drive can be busy because of sustained reads or writes, many small random operations, antivirus scanning, cloud synchronization, a nearly full drive, or another process competing for access.
Task Manager’s disk percentage shows active time, while Resource Monitor can identify the process and files involved. High active time with low transfer rates can still indicate a problem when the workload consists of small, scattered requests. Mechanical hard drives are especially vulnerable to this pattern.
📂 Test Loading, Copying, and Saving Separately
Long game loads may involve asset decompression by the CPU, storage reads, and sometimes network checks. A slow file copy can depend on the source drive, destination drive, USB connection, file sizes, and antivirus inspection. “The SSD is slow” may be too simple an explanation.
Test one operation at a time. Copy a large file between known drives, save a project locally, or load the same level repeatedly after a restart. If a different drive or folder changes the outcome, you have narrowed the source of the delay.
🌡️ Rule Out Thermal Throttling
Processors and graphics cards reduce their clock speed when temperatures, power limits, or other protective limits are reached. This behavior is called throttling. It can turn a system that starts fast into one that slows down after several minutes.
Log temperatures and clock speeds from the beginning of a workload. If performance drops at the same time clocks fall and temperatures rise, cooling deserves attention. Dust buildup, restricted airflow, an aging fan, poor cooler contact, and unsuitable laptop placement can all contribute.
🔌 Check Power Modes and Laptop Limits
Laptops often use conservative power settings on battery to preserve runtime and control heat. Some may use a lower-power integrated GPU unless an application is assigned to the discrete GPU. Desktop systems can also use power plans that reduce responsiveness.
For testing, connect a laptop to its correct charger, select an appropriate performance mode, and confirm which GPU the application uses. Do not assume a high-performance mode is best for every situation: it increases heat, noise, and energy consumption.
🌐 Treat Network Delays as a Separate Problem
Online lag can feel like poor PC performance, but it may be caused by latency, packet loss, Wi-Fi interference, server load, or another device using the connection. A powerful GPU cannot correct a delayed response from a remote server.
Network issues often appear as delayed actions, teleporting players, voice dropouts, or slow downloads while local frame rate remains steady. Check whether the problem occurs in offline tasks too. If it does not, investigate the connection before planning a hardware upgrade.
🧹 Look for Background Processes and Overlays
Updates, browser tabs, recording software, RGB utilities, cloud backup tools, security scans, and game overlays can consume CPU time, memory, storage bandwidth, or GPU resources. Their impact is usually greatest on systems already close to a limit.
Sort Task Manager by CPU, Memory, Disk, or GPU while the problem occurs. Close only applications you recognize and do not disable security software permanently. A clean test session can reveal whether the main workload or an extra process is responsible.
🧪 Change One Variable at a Time
A controlled experiment is more useful than a collection of guesses. Change one setting, repeat the same workload, and note the result. For games, resolution is a good GPU test; view distance, simulation density, or crowd settings may stress CPU work more directly.
For productivity tasks, try a smaller project, a different storage location, fewer open applications, or a hardware-accelerated option where available. If a change improves the symptom, it identifies the type of work that was constrained, even if it does not identify every underlying cause.
🗂️ Keep a Simple Performance Log
Write down the workload, symptom, settings, average behavior, and any spikes. You do not need a complicated benchmark database. A short record stops you from relying on memory after many changes.
| Observation | Likely direction to investigate | Useful follow-up |
|---|---|---|
| GPU stays near full use; lower resolution improves FPS | Graphics workload or GPU limit | Adjust visual settings or compare GPU options |
| One CPU core is saturated; lower resolution changes little | CPU or game-engine limit | Reduce CPU-heavy settings and background tasks |
| Freezes coincide with disk activity and memory pressure | RAM capacity or paging | Close applications; consider more compatible RAM |
| Performance falls after warming up; clocks decrease | Thermal or power limit | Inspect cooling and power configuration |
These are diagnostic leads, not absolute rules. More than one limit can exist at the same time.
🧱 Beware of Artificial Benchmarks
Synthetic benchmarks can compare components under controlled conditions, but they do not perfectly predict your own software. A score may reveal that hardware is performing unusually below expectations, yet it cannot tell you whether your favorite game is CPU-bound in a particular location.
Use benchmarks as a supporting check. Your actual workload remains the most relevant test, especially for specialized professional software, large files, plugins, or unusual project settings.
⚙️ Check Drivers, Updates, and Settings Before Buying
Outdated or corrupted graphics drivers, incorrect application settings, a game patch, limited storage space, or an accidental frame cap can create performance problems that look like hardware limits. A recently changed system deserves a software check before a purchase.
Install drivers from the hardware manufacturer or trusted system source, apply relevant application updates, and restart after major changes. Avoid downloading “driver updater” utilities that make broad, unclear changes. If a problem began immediately after an update, compare behavior carefully rather than assuming newer is always better.
🧷 Verify Memory, Storage, and PCIe Configuration
Configuration errors can leave good hardware underperforming. Memory may run at a conservative default speed if its approved performance profile is not enabled. A storage drive may be nearly full, connected through a slower interface, or operating with a fault that needs investigation.
These checks require care because firmware settings vary by device. Read your motherboard or laptop documentation before changing options, and do not alter unfamiliar voltage or overclocking settings just to chase a small benchmark gain.
🔧 Match the Upgrade to the Real Workload
Once you have evidence, choose the upgrade that addresses the constraint. A gamer targeting higher visual quality at the same CPU-friendly settings may benefit most from a GPU. Someone running many virtual machines, large datasets, or extensive browser sessions may need more RAM and perhaps faster storage.
CPU upgrades require wider compatibility checks: motherboard socket, firmware support, memory type, cooler capacity, and power supply headroom may matter. A balanced plan considers the entire platform rather than selecting the component with the largest marketing number.
💰 Know When an Upgrade Will Not Help Much
If a game is limited by its engine, a server, or a single CPU thread, a much faster GPU may produce only a modest improvement. If video editing is waiting for a slow network share, more local CPU power will not remove that wait. If a laptop is throttling, a replacement component may not solve the cooling design limit.
Sometimes the best response is a setting change, a workflow change, cleaning and cooling maintenance, or accepting that a particular program has a fixed limitation. Diagnosis protects your budget as much as performance.
🚫 Avoid Common Bottleneck Diagnosis Mistakes
- Judging the system while it is idle instead of during the troublesome task.
- Assuming 100% usage is always bad; a busy component can be working efficiently.
- Using total CPU percentage and ignoring individual cores.
- Calling every stutter a GPU issue without checking frame time, storage, RAM, and temperatures.
- Changing several settings or parts at once and losing the evidence trail.
- Comparing results from different game scenes, power modes, or background workloads.
- Trusting a generic online “bottleneck calculator” more than measurements from your PC.
Calculators can offer rough compatibility context, but they cannot know your resolution, software, settings, thermal conditions, or daily workload.
🧰 A Practical Diagnostic Routine
- Describe one repeatable symptom and choose a test scenario.
- Close unnecessary applications and confirm power, driver, and basic temperature conditions.
- Monitor CPU per-core activity, GPU use, RAM, disk activity, temperatures, clocks, and frame time where relevant.
- Repeat the task and record the pattern rather than a single peak reading.
- Change one meaningful variable, such as resolution, a CPU-heavy setting, open applications, or storage location.
- Interpret the result alongside the readings, then decide whether maintenance, configuration, or hardware is justified.
This process may take longer than guessing, but it produces a decision you can explain and repeat.
🎯 Focus on the Component Limiting Your Experience
The central lesson is simple: a bottleneck is not a permanent label attached to a PC part. It is the resource that constrains a specific task under specific conditions. The same system can be GPU-bound, CPU-bound, storage-bound, memory-constrained, thermally limited, or network-limited at different moments.
Observe the workload, use readings as clues rather than verdicts, and test changes deliberately. That approach turns “my computer feels slow” into a solvable question: what is waiting, why is it waiting, and what is the least wasteful way to improve it?
Measure the task you actually care about, then fix the part of the system that is demonstrably holding that task back. A little methodical testing can save money and make every upgrade more satisfying. 🖥️🔍⚙️