
Your computer was running normally this morning. Then a browser tab begins to stutter, the cooling fan grows louder, and even opening a folder takes longer than it should.
Closing the window you were using may not fix it. A program can keep working in the background, a service can be updating itself, or several ordinary tasks can be competing for the same limited resource.
The useful question is not simply, “Why is my computer slow?” It is: which resource is under pressure, and which process is using it? Once you can answer that, troubleshooting becomes far more precise.
This guide explains how to investigate CPU, memory, disk, network, and graphics use on Windows, macOS, and Linux—without assuming that the biggest number always identifies a problem.
🧭 Start With the Symptom You Can See
Begin with what the computer is actually doing. A delayed mouse pointer, a frozen video call, a spinning loading indicator, and a slow file copy may look similar, but they can have different causes.
For example, a computer that reacts slowly while its fan is loud may be handling a CPU-intensive task. A system that pauses when opening files may instead be waiting for its storage drive. Observing the symptom first gives your investigation direction.
🧠 Understand What “Resources” Means
A computer shares a small set of essential resources among programs. The operating system decides which process gets processor time, memory space, disk access, network bandwidth, and—where relevant—graphics processing time.
A process is an active instance of a program or system component. One application can create many processes. Your web browser, for instance, may use separate processes for tabs, extensions, graphics work, and background services.
⚙️ Know the Five Main Resource Categories
The resource monitor in your operating system usually reports several categories. Each one answers a different question.
| Resource | What it does | Common sign of pressure |
|---|---|---|
| CPU | Executes instructions | Sluggish response and active cooling fans |
| Memory (RAM) | Holds data programs need quickly | Apps reload, pause, or switch slowly |
| Disk | Reads and writes files and system data | Programs hang during loading or saving |
| Network | Sends and receives data | Slow downloads, calls, or cloud syncing |
| GPU | Draws graphics and handles parallel visual work | Choppy games, video, or design software |
A high reading is not automatically bad. Rendering a video should use hardware heavily. The concern is sustained or unexpected activity that prevents the work you need from running well.
⏱️ Check Whether the Slowdown Is Temporary
Wait briefly before stopping anything. Right after startup, operating systems may index files, synchronize cloud folders, install updates, scan for threats, or reopen applications from a previous session.
Short bursts are normal. A task that uses many resources for a few seconds and then settles down is different from one that stays busy for many minutes while you are not doing anything demanding.
🪟 Open Task Manager on Windows
On Windows, press Ctrl + Shift + Esc to open Task Manager directly. You can also right-click the taskbar and choose Task Manager, although the exact menu may vary by Windows version.
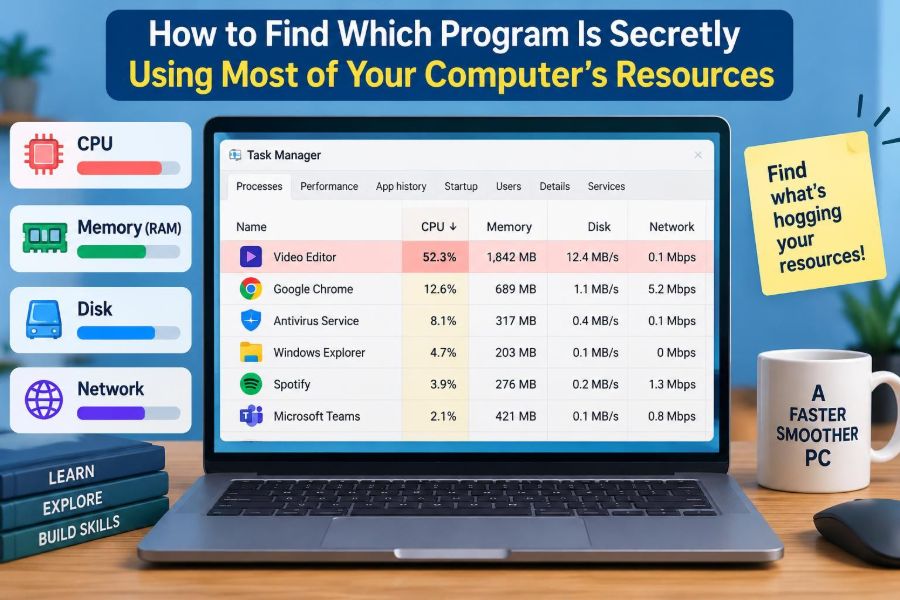
The Processes view is the best starting point. It groups open apps, background processes, and Windows processes, while showing current CPU, Memory, Disk, Network, and often GPU use.
🔍 Sort Windows Processes by the Busy Resource
Select the column heading for the resource that appears overloaded. If CPU is high, click CPU; if the disk seems busy, click Disk. Click again if you need to reverse the order.
This simple action turns a long list into a useful ranking. Look for the program consistently near the top, rather than reacting to a process that briefly appears there during a normal operation.
Expand an app group using the small arrow beside it. That can reveal whether one browser tab, helper process, or child component is responsible.
📊 Read Windows Performance Without Guessing
The Performance tab shows system-wide activity over time. Use it to confirm which resource is saturated before blaming the process list.
- CPU near its available capacity for an extended period can make the whole system less responsive.
- Memory that remains nearly full may force Windows to move data between RAM and storage.
- High disk activity matters most when response time and active time remain high while programs are waiting.
- Network graphs help distinguish a slow connection from a program that is actively transferring data.
These readings are clues, not diagnoses. A fast storage drive can show high activity while still serving requests quickly; an older or overloaded drive can create noticeable delays with less dramatic-looking throughput.
🧰 Use Resource Monitor for a Closer Windows View
From Task Manager, search for or open Resource Monitor when the basic view is not enough. It provides more detail about individual processes, disk files, network connections, and memory behavior.
In the Disk section, you can see which files a process is reading or writing. That is particularly helpful when a vague process name is using the drive: it may turn out to be an update, a backup, a search index, or a cloud-sync operation.
🍎 Open Activity Monitor on macOS
On a Mac, open Activity Monitor through Applications, Utilities, or Spotlight search. It is the macOS equivalent of Task Manager and organizes information into CPU, Memory, Energy, Disk, and Network views.
The list includes apps you recognize and background services you may not. Select a column heading, such as % CPU or Memory, to sort the list and identify the current leaders.
📈 Interpret the macOS CPU and Memory Tabs
The CPU tab reveals processes using processor time. A temporarily high value can be expected while exporting media, compiling code, or applying an update. An unfamiliar process that stays high after the related work has ended deserves more investigation.
For memory, pay attention to Memory Pressure, shown as a graph near the bottom of Activity Monitor. This is more informative than treating any single memory figure as a failure. Green generally indicates that macOS is managing memory comfortably; persistent yellow or red can signal pressure.
💾 Inspect Disk and Network Activity on macOS
The Disk tab shows data read and written by each process. Sort by recent activity when the machine becomes slow while saving, opening, copying, or synchronizing files.
The Network tab helps identify large transfers. A backup tool, cloud-storage client, game launcher, or browser download can consume bandwidth even when no obvious download window is open.
Activity Monitor can also show open files and network connections through its inspection tools. Use those details carefully: a connection or file path often provides context, but it does not alone prove that a process is unsafe.
🐧 Find Processes on Linux
Most Linux desktop environments include a graphical system monitor, often called System Monitor, System Monitoring Center, or a similar name. Its exact appearance differs by distribution, but the basic approach is familiar: sort processes by CPU, memory, disk activity, or network use.
On the command line, top is widely available. The interactive tool htop, if installed, is often easier to read because it shows a process tree, uses visual meters, and lets you sort or search interactively.
⌨️ Use Linux Commands With Care
A command such as ps aux --sort=-%cpu can list processes with high CPU use first. Replacing %cpu with %mem helps locate memory-heavy processes. These are snapshots, so run them again if activity changes quickly.
For disk input and output, tools such as iotop may be available, depending on your distribution and permissions. Network tools can show connections and traffic, but their output can be technical. Start by identifying the application name and user account before taking action.
🧮 Learn the Difference Between CPU Percentage and CPU Time
CPU percentage describes how much processor capacity a process is using at the moment or over a short interval. CPU time is the accumulated amount of processor work a process has used since it started.
A program with large total CPU time may simply have been open all day. A smaller process with a high current CPU percentage is more likely to explain a slowdown happening right now. Always compare the right measurement to the problem you are seeing.
🧠 Recognize Memory Pressure and Swapping
RAM is fast working space. When many programs need more RAM than is readily available, the operating system may move less-active data to storage. This is often called paging or swapping.
Storage is much slower than RAM for this purpose, so frequent swapping can make app switching and loading feel delayed. The remedy is not always to close the biggest memory user: a large application that is actively needed may be reasonable, while many idle apps together may be the real strain.
💽 Distinguish Disk Use From Disk Capacity
Disk use in a monitor refers to current read and write activity. Disk capacity refers to how much free storage space remains. They are related only indirectly.
A nearly full drive can complicate updates, temporary files, and normal system housekeeping. But a drive with plenty of free space can still be busy because an application is scanning, downloading, indexing, compressing, or backing up large amounts of data.
🌐 Track Hidden Network Consumers
Background network use is common. Cloud synchronization, operating-system updates, photo libraries, streaming clients, workplace tools, and game platforms may transfer data outside their main windows.
Sort by network activity, then ask a practical question: does this program have a reason to communicate right now? If it does, you may be able to pause its sync, schedule it for later, or set a bandwidth limit in that program’s settings.
Do not assume all traffic is suspicious. Many core services need network access for ordinary functions such as time synchronization, notifications, licensing, updates, and security checks.
🎮 Check the GPU When Visual Work Is Slow
The graphics processing unit, or GPU, handles screen drawing, video effects, games, 3D applications, and certain specialized calculations. On Windows, Task Manager can show GPU use and, on supported systems, which GPU engine is active.
High GPU use during a game or video editor may be expected. High use from a browser tab, a desktop effect, or an unknown background process is worth checking—especially if the screen flickers, visual applications lag, or the computer becomes unusually warm.
🌳 Identify Parent Processes and Process Trees
Process names alone can mislead. A helper process may have a generic name, while its parent application explains why it exists. A process tree shows which process launched another process.
Browsers are a good example: separate processes improve stability and security, so seeing many browser-related entries is not inherently abnormal. On Linux, htop can display a tree; other platforms provide ways to inspect a selected process or its related items.
🏷️ Verify an Unfamiliar Process Before Stopping It
Unknown does not mean malicious. Operating systems, hardware drivers, security software, and installed applications often use technical filenames that are not designed for everyday recognition.
Check the process details first. Look for its full name, publisher or developer information where available, file location, and parent application. A program stored in its expected application or system folder is not automatically trustworthy, but location provides more context than a short name alone.
- Search the exact filename together with your operating system version.
- Check whether it belongs to software you knowingly installed.
- Review recent installs, browser extensions, and startup items if the timing is suspicious.
- Run your trusted security tool if the process cannot be explained.
🛑 End a Task Only When You Understand the Trade-Off
Ending a process can immediately free resources, but it can also discard unsaved work or interrupt a necessary task. Force-quitting is most appropriate when an application is frozen, clearly misbehaving, or safe to restart.
Avoid casually ending operating-system processes, services, drivers, or items whose role you do not understand. The system may restart them, become unstable, lose a device feature, or log you out. Restarting the computer is often the safer first reset when the source is uncertain.
🔄 Restart the Responsible App, Not Just the Symptom
If one application has become resource-hungry, close it normally and reopen it. This can clear a stuck operation, release a problematic tab or document, and refresh its connection to a service.
Suppose a browser consumes unusually high memory after several days of use. Restarting the browser may help, but also inspect its tabs and extensions. Otherwise, the same demanding page or extension can recreate the problem immediately.
🧩 Investigate Browser Tabs and Extensions
Browsers often create separate processes deliberately, so the operating system may not identify the exact webpage. Most major browsers include their own task manager or performance view that can reveal resource use by tabs, extensions, and internal components.
Close or reload the specific tab that is misbehaving. Disable extensions one at a time if the problem recurs. Extensions can consume CPU, memory, and network data even when they are not visibly doing much.
🚀 Review Startup Apps and Background Helpers
A slow computer shortly after sign-in may be launching too many programs at once. Chat clients, sync tools, update agents, creative suites, device utilities, and game launchers commonly add background helpers.
Review startup items in your operating system’s settings or task manager. Disable automatic launch only for software you recognize and do not need immediately. This does not uninstall the application; it simply stops it from starting with every login.
🔄 Let Updates Finish, Then Check Their Pattern
Updates can temporarily consume CPU, disk, and network capacity. Interrupting them repeatedly can create more trouble than waiting for them to finish, particularly when system files or application databases are being changed.
However, an update task that appears stuck for an unusually long time or reappears constantly may indicate a failed update, corrupted cache, inadequate storage, or a software conflict. Check the update history and the application’s own status rather than assuming the task is normal forever.
🛡️ Treat Unexpected Activity as a Security Clue, Not Proof
Unexpected resource use can result from unwanted software, including browser-based miners, adware, or malicious programs. It can also result from entirely legitimate maintenance tasks. Resource use by itself is not enough to classify software.
Warning signs become stronger when several clues appear together: an unfamiliar process returns after being closed, the startup list contains unexplained entries, browser settings change without permission, or a trusted security scan detects something. Keep your operating system and security tools updated, then follow the removal guidance provided by the tool.
🌡️ Consider Heat, Power Mode, and Hardware Limits
A computer can feel slow even if no single program looks outrageous. Heat can cause some processors to reduce speed to protect hardware, a behavior commonly called thermal throttling. Battery-saving modes can also intentionally limit performance.
Check whether air vents are blocked, whether the device is charging as expected, and whether the workload matches the hardware. A demanding modern application may be legitimate yet still exceed the comfortable capability of an older computer or a low-power laptop.
🧹 Fix the Cause Instead of Repeatedly Killing Processes
Repeatedly ending the same task is a clue that you need a longer-term solution. Update or reinstall the specific application, remove an unnecessary extension, reduce its workload, change its sync schedule, or contact the software provider if a reproducible bug is involved.
For a workload problem, divide work into smaller pieces. For example, process a smaller batch of photos, close unused projects in a development tool, or run a backup outside working hours. The best fix depends on why the resource is being used.
📝 Record What Happens Before the Problem Starts
Intermittent problems are easier to solve when you keep a small record. Note the time, the active application, the resource that peaked, and any related event such as connecting a drive, joining a video call, waking the computer, or opening a particular file.
This turns vague impressions into a pattern. If disk activity always spikes after connecting one external drive, the drive or its indexing process becomes a useful lead. If CPU rises only during one meeting platform, you can test its settings, updates, and browser version.
🧪 Use a Clean Test to Isolate the Cause
When you suspect a particular application, test it in a controlled way. Restart the computer, open only that application, repeat the action that triggers the problem, and watch the relevant monitor.
Then compare it with a simpler case. A video editor may run smoothly with a short standard-definition clip but struggle with a large high-resolution project. That comparison identifies a workload limit rather than implying the editor is defective.
⚠️ Avoid Common Troubleshooting Mistakes
Several habits make resource problems harder to diagnose:
- Blaming the top process without checking the resource: the largest memory user may not be causing a disk-related pause.
- Force-quitting system components: this can create instability without solving the original cause.
- Installing random “cleaner” utilities: they may add background load or make broad changes you cannot evaluate.
- Testing too many fixes at once: you lose the ability to tell which change helped.
- Ignoring free storage: low space can worsen normal maintenance and update behavior.
🧭 Build a Repeatable Resource-Checking Routine
A reliable routine is simple: observe the symptom, open the system monitor, confirm the pressured resource, sort by that resource, identify the persistent process, verify what it is, and choose the least disruptive fix.
For routine health checks, you do not need to watch these tools constantly. Use them when a problem appears, after installing unfamiliar software, or when you notice a recurring slowdown. Monitoring has value when it helps you make a specific decision.
✅ The Core Principle: Match the Process to the Pressure
The most useful skill is not memorizing every process name. It is learning to connect a real symptom with the correct resource measurement and then with a process that has a clear reason—or no clear reason—to be using it.
High usage is often normal when it matches your work. It becomes actionable when it is persistent, unexplained, disruptive, or accompanied by other warning signs. Verify first, then close, reconfigure, update, or investigate based on evidence.
When your computer slows down, identify the constrained resource before trying to fix the program: the right measurement turns a mysterious slowdown into a manageable problem. 🖥️🔎⚙️